Smart Corridor
ATMS Smart Corridor Dashboard is represented by the icon in the left hand navigation menu.
Smart Corridor is the ATMS first managed part time shoulder lane, called the Flex Lane.
The Flex Lane is a type of managed lane categorized by the FHWA as part-time shoulder use. A managed lane on a roadway improves traffic operations through 'active management'. ATMS operates the Flex Lane by opening it and closing it to traffic based on traffic speeds and volumes so that travel time reliability is improved. The intent of the Flex Lane is to provide operational flexibility on highway, which experiences recurring and non-recurring congestion. Flex Lane use is limited to passenger cars only with trucks prohibited except for emergency situations.
Dashboard
ATMS software was modified to provide a Flex Lane dashboard to facilitate operation of the Flex Lane. The ATMS software Flex Lane dashboard integrates the ITS field components of the Flex Lane and presents the traffic data to TMC control room operators to allow them to properly operate the Flex Lane system.
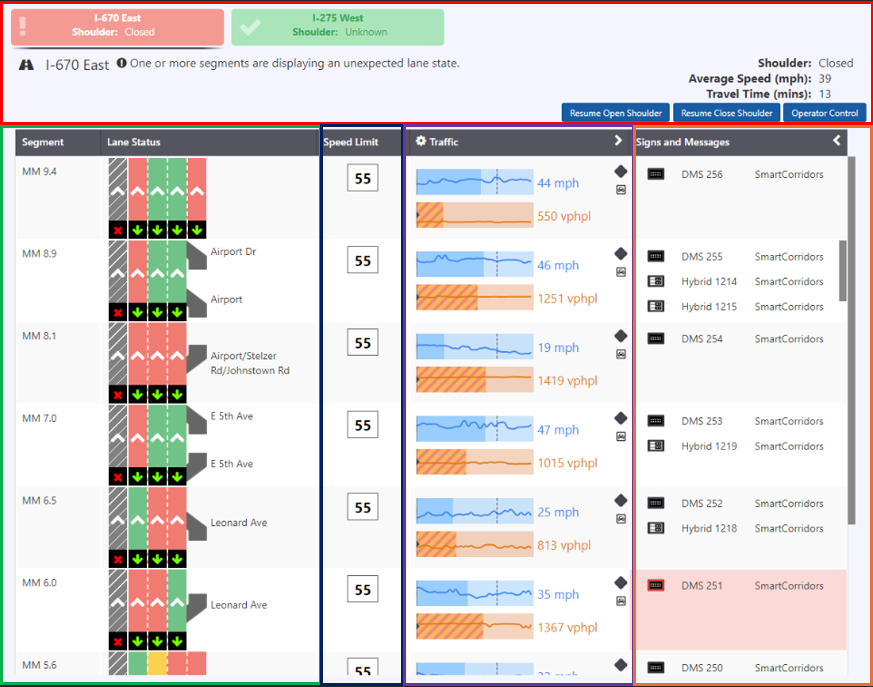
The corridor dashboard will be the primary interface to control and monitor devices and events on the corridor. Functionality to view devices, monitor traffic conditions, receive shoulder recommendations, and open/close the shoulder will be access through this interface. In general, devices and events will be accessible from this dashboard but open on the main ATMS map.
Corridors
Corridors can be selected for viewing the traffic conditions bi-directional. Switch the corridors by clicking them. The selected corridor is highlighted.

This section contains general information about the corridor, including:
- Corridor name
- Current average traffic speed on the corridor
- Speed trend (increasing, decreasing, level) for the corridor
- Current travel time along the corridor
- Travel time trend (increasing, decreasing, level) for the corridor
System recommendation is populated if there is any error in Segment.
Segment and Lane Status
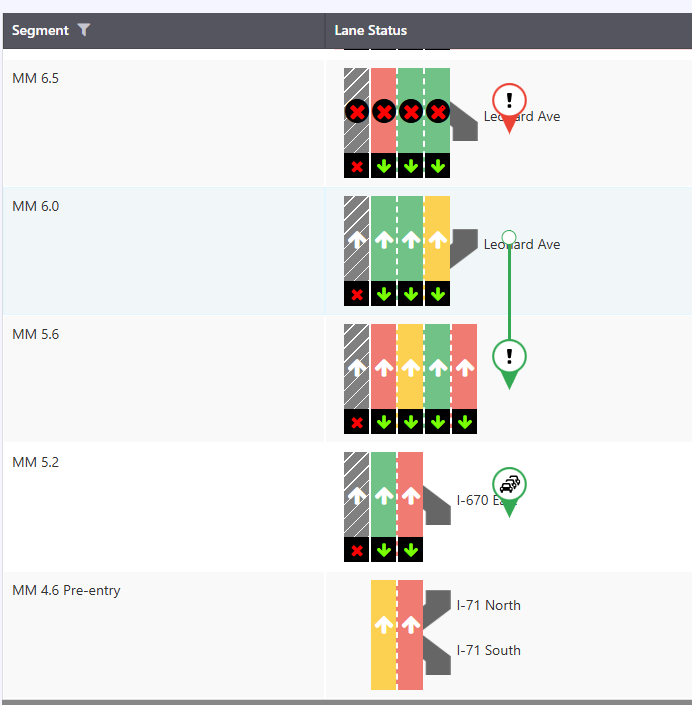
The collection of segments configured as part of the corridor indicating the name of each segment.
A schematic view of the roadway showing:
Start and end points for each segment
The lane pattern of each segment - the shoulder is distinct from the normal travel lanes in the lane representation
The lane control state of each managed lane
Color coding indicating the current traffic speeds by lane - the shoulder only display traffic conditions when it is open
Entrances and exits from the roadway (can be based off of reflocs with connection type onramp or offramp) including their name
Location of any active events (Unplanned or Planned) that are blocking lanes on the corridor, and the specific lanes that are blocked for each segment (a linear event may impact multiple segments - segment lane show as blocked if the event overlaps any part of the segment)
| Lane Pattern | Status |
|---|---|
| Lane open | |
| Lane closing soon | |
| Lane closed |
Traffic and Speed
Traffic describes volume and speed data associated with each segment of the corridor. A graph showing current speeds and volumes along the corridor, aligned with the schematic detection sites can be associated with a segment, and points on the graph for speed and volume can be presented at a point in the cell or area matching that segment that is a proportional distance into the cell matching the proportional distance of the device location along the segment from its start point
Speed and volume are plotted on separate axes
The speed series can be a line
Volume series are an area plot
Displayed speed and volume are smoothed values, not based on a single 20s polling interval
Select 'Show trend limits' to view the historical trend of Volume and Speed.
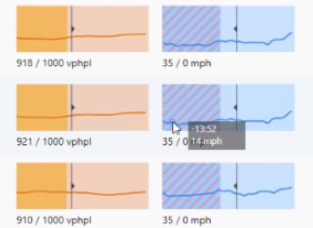
Exact volume/ speed can be viewed by hovering over the trend line graph.
Speed
The dark blue shading describes the current speed of the segment.
The straight line describes the threshold on which the shoulder / lane should be opened.
The thread line depicts the historical trend of what speed has done within 15 minutes.
The number depicts the average speed within 15 minutes for each segment.
NOTE : not all eventual users of this dashboard will have variable speed control on the corridor, so it should be possible to hide this (based on whether speed control is configured for a segment)
Volume
The dark yellow shading describes the current volume of the segment.
The straight line describes the threshold on which the shoulder / lane should be opened.
The thread line depicts the historical trend of what volume has done within 15 minutes.
The number depicts the average volume within 15 minutes for each segment
Traffic layer can be managed by collapsing or expanding

VDS and RTMS
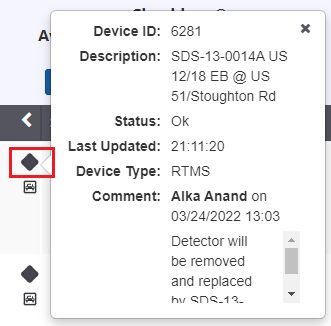
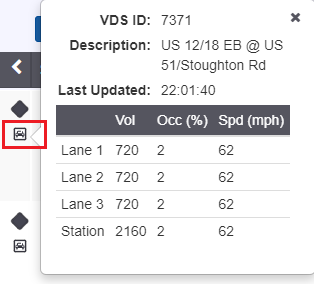
The VDS and RTMS come from ATMS and could be seen on Smart Corridor by hovering over the icon
Click on the RTMS icon to view details.
Click on the VDS icon to view details.
Signs and Messages
The signs come from ATMS and could be seen on Smart Corridor by hovering over the sign icon
The LCS properties could be viewed by clicking on icon either on ATMs, opens to the ATMS window, or on Window, opens to an another window.

CCTV
Hover on CCTV icon to view the CCTV view for the segment.
Shoulder Workflow
Shoulder process can be managed by Open Shoulder / Close Shoulder or Operator Control managing the process.
Click to visit Lane Sweep, LCS Verification, Activate Camera Preset Group.